With GeoDataFarm, apart from visually observing data on the map and draw manual conclusions, you can run spatial analysis. With the analysis tools you may analyse what really affected the yield, how did the planting distance or the irrigation effect the yield outcome.
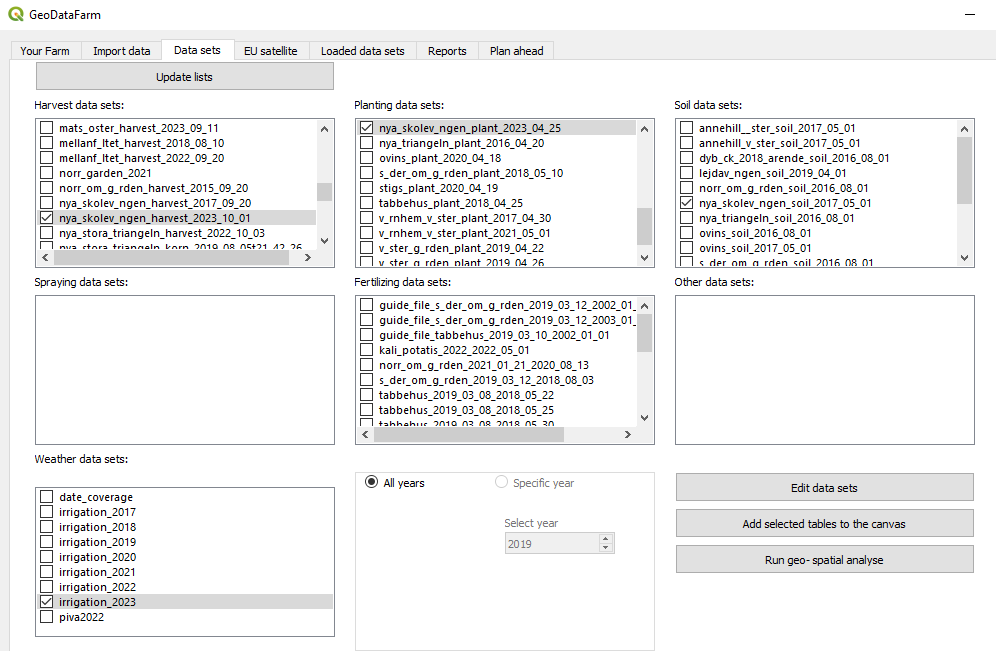
To run the analyse tool you need to select the data sets that you want to analyse (every harvest data set must correspond to another data set with data from the same field and year (except the soil data). When all layers are selected press Run geo- spatial analyse.
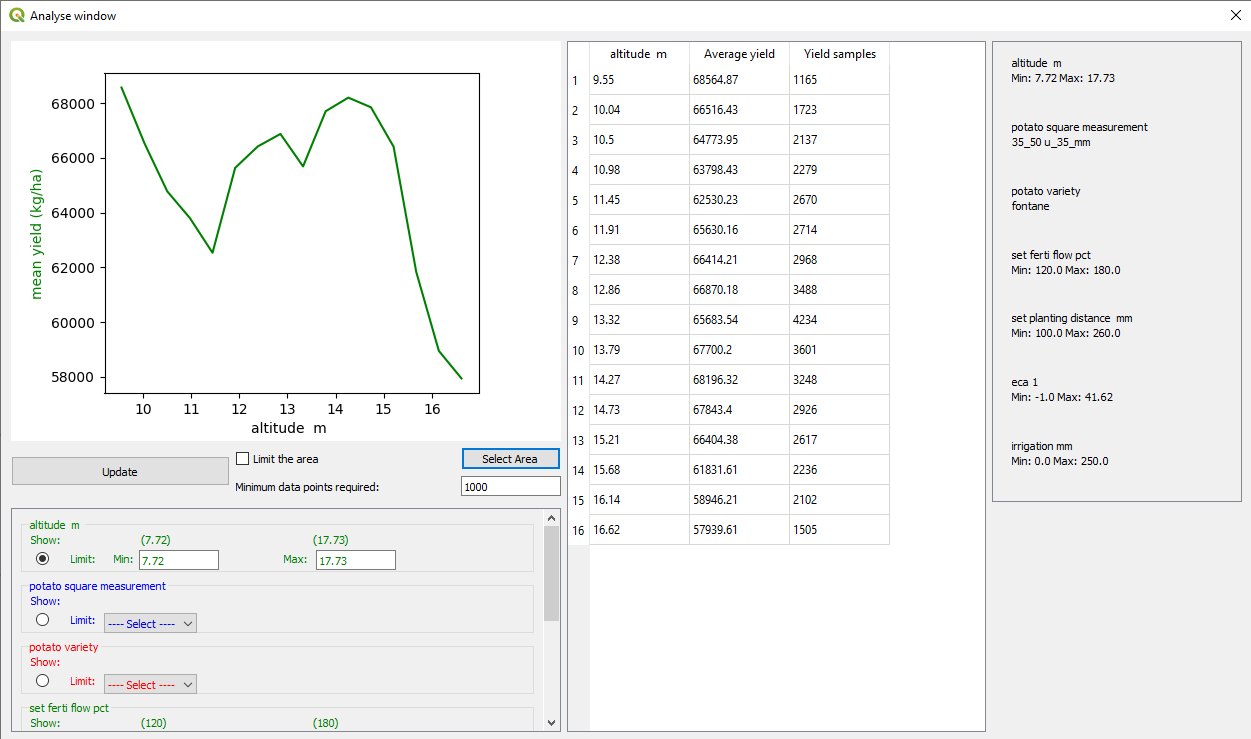
This will probable take a little while, but soon you will se a window like this. Here you can see a graph how the yield varies with a selected parameter, in this case the altitude amount. The three columns
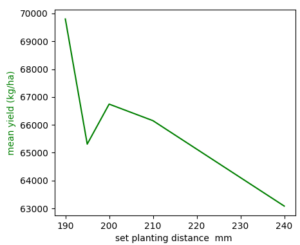
The graph with a selected parameter, and underneath you can first limit the number of datapoints that is required to show the graph or create a area to limit the analysed area. Underneath this you se a list with all parameters where you can select what parameter to show and “limit”, that and all the other parameters.
A table with the data that displays the values of the graph, the average yield and on how many yield samples it covers. This last column tells the evidence level of the yield, if it is only a few points you might disregard the value.
The last column to the right shows the limit/selected values that is displayed.