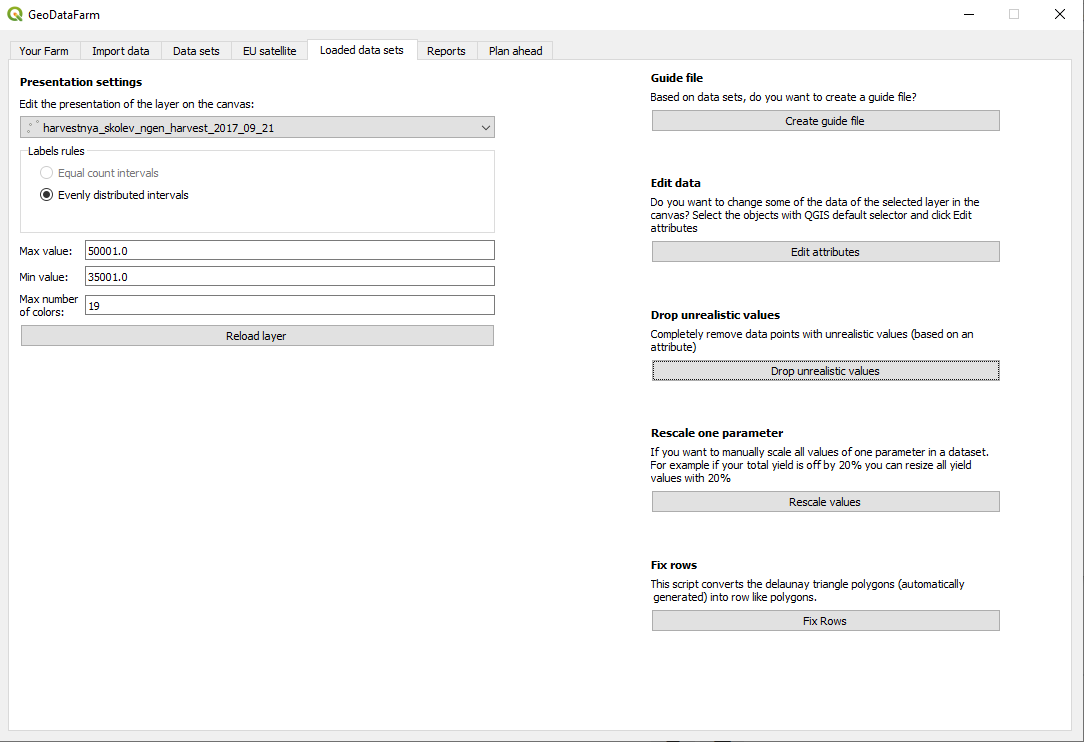
Within GeoDataFarm there two major places where you may edit your datasets. One place where you can make multiple types of changes is on the Loaded data sets tab (as illustrated to the left) and the other place is under the Data sets tab (which is described in Edit data 2). On the left side you can change the presentation of a layer in the canvas. On the example you can see the layer harvestnya_lajdav_ngen_harvest_2017_09_21, where the minimum value (most red) is 35 000, the maximum value (most green) is 50 000 and there is 19 different colors between red-yellow-green. (This is something that you can also edit if you right-click on the layer directly in QGIS, select properties and look on Symbology tab).
In the right side there are five different options with a seperate pop-up described here bellow.
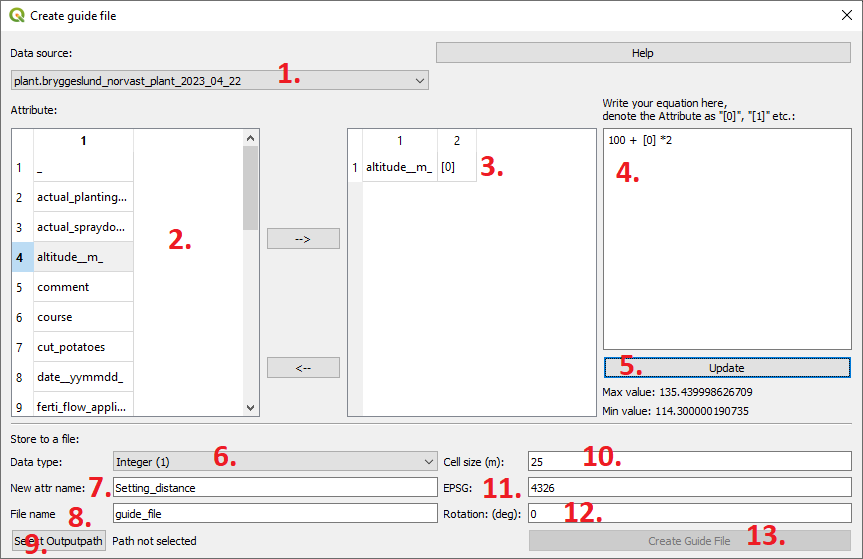
Create Guide file
When you press it you get this dialog.
Select which data set that you want to base your guide file on.
Select the attributes that you want to use from the data set.
All attributes gets associated with one [number].
Here you write the equation for your guide file. In this case the guide file is going to be equal to 100 + the average (in that each cell) altitude * 20
When you have created the equation press Update and the max/min values bellow gets updated (114.3 resp. 135.44).
Select what type of data that you to have in the output file (integer or float).
The name of the attribute of the coming guide file, Setting_distance.
The name of guide file, guide_file .
Select where you want to store the guide file (available after you have pressed on Update).
The cell size of the grid that is created, 25.
The EPSG system, in 999 of 1000 cases is 4326 (latitude and longitude) the correct coordinate system.
Rotation, do you want to rotate the grid, 0.
Press Create guide file to generate the guide file (available after you have Select Outputpath).
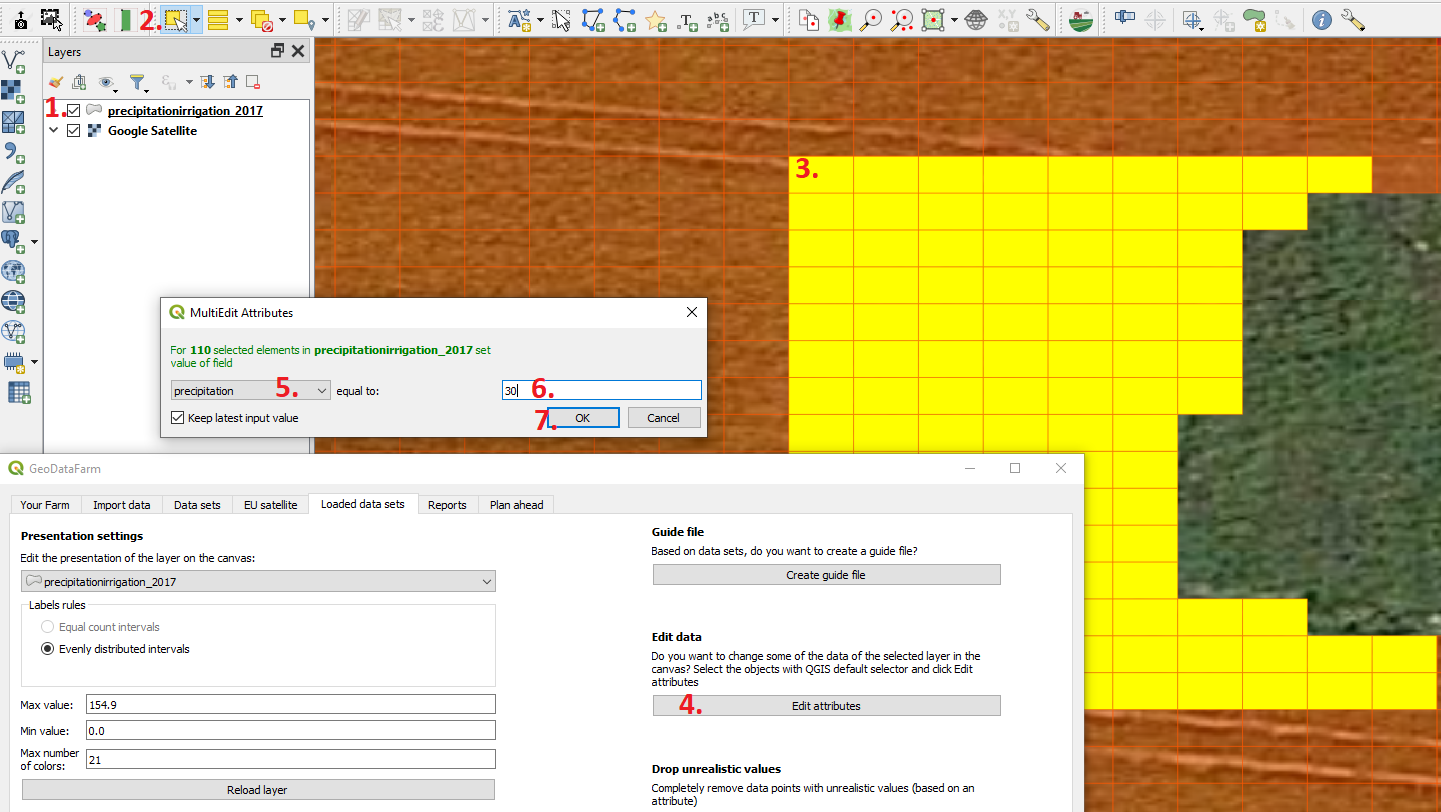
Edit attributes
If you want to change multiple attributes of a layer that you have loaded you can do that with Edit Attributes.
Start with selecting the layer that you want to edit.
Change the QGIS tool to Select features.
Left click (and hold down) to select some features to edit (when you let go you will select features in a square), to add more areas to the selection hold Shift and to remove some areas hold down Ctrl.
When the areas you want to change values of are selected press on the Editattributes button in the GeoDataFarm window/Loaded data sets tab.
Select the attribute that you want to adjust the values of.
Set a new value.
Press OK.
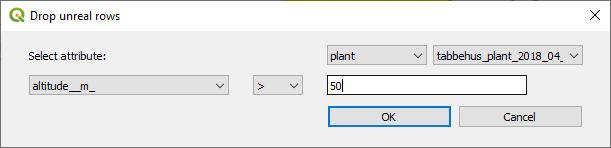
Drop unrealistic values
If you instead want to delete some areas that contains unreal values you can do that with Drop unrealistic values. In this window you select the type of data, name of the dataset, the attribute name, the operator (smaller/larger) and the value.
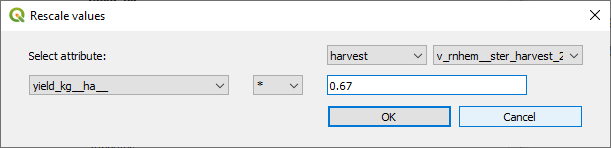
Rescale values
To rescale an attribute (or adjust all attributes with a factor), press on Rescale values select thetypeof data, name of thedataset, theattributename, theoperator(plus, minus, times with or divided with) and thevalue. Say that your yield actually was 50 000 kg/ha but the data that you have added to GeoDataFarm says that average yield was 75 000 kg/ha than you can multiply all values with 0.67.
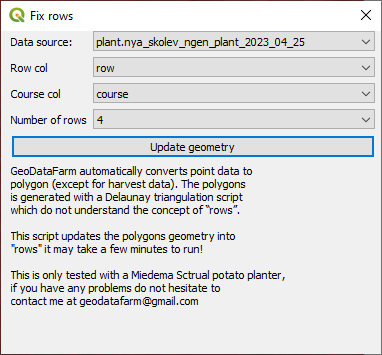
Fix Rows
To make this change go press on Fix Rows. Select the data source, which attribute that contains the “row column”, the “course attribute” and how “many rows” that it machine contains.