How to create a guide file
A guide file (also known as a prescription map or variable-rate application map) lets you turn your collected field data into a file your machinery can read for site-specific management. GeoDataFarm builds a grid over your field and calculates a value for each cell from an equation you define.
GeoDataFarm can write the guide file in two formats, each on its own tab:
- Shapefile — a polygon shapefile (
.shp), the most widely supported format. Choose this if you are unsure. - ISO-XML — an ISO 11783-10 task dataset (
TASKDATA.XML+ binary grid) for ISOBUS terminals, optionally tied to a product you manage in the Product tab.
Prerequisites
Before you start, make sure you have:
- Created a farm and connected to it.
- Added at least one field.
- Imported at least one data set (e.g. harvest, soil, fertiliser) for that field.
Open the guide file tool
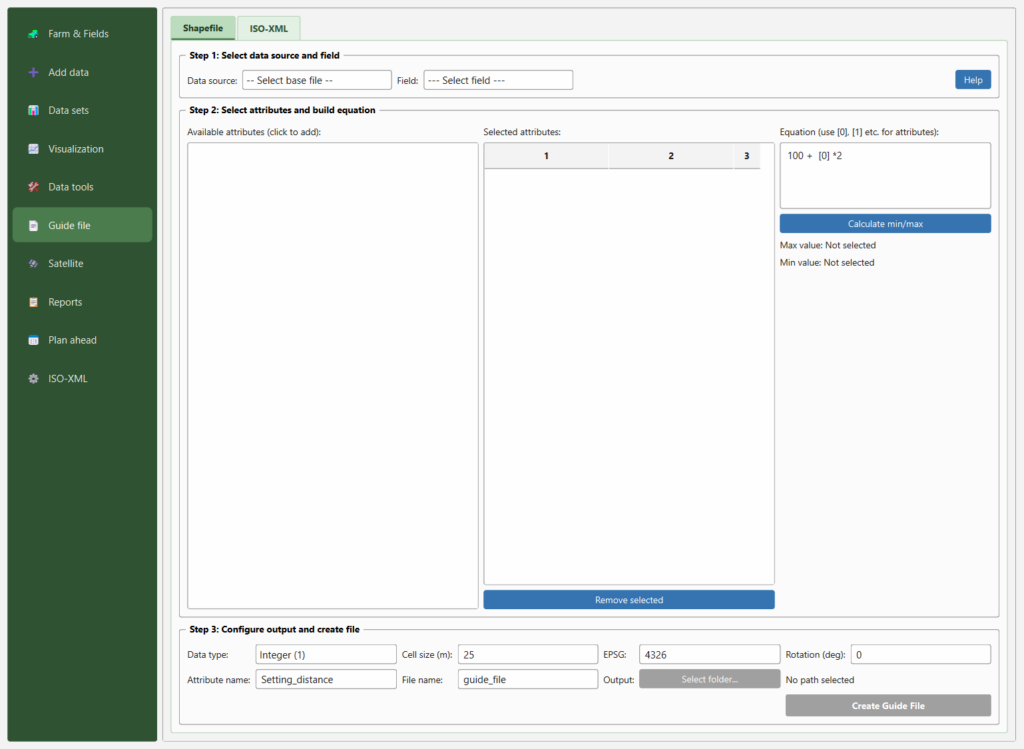
In the GeoDataFarm dock, click 📄 Guide file in the navigation sidebar on the left. The tool opens with two tabs at the top — Shapefile (light green, selected by default) and ISO-XML. Both tabs share the same three-step workflow; only the output settings in Step 3 differ.
Steps 1 & 2 (shared by both tabs)
Step 1 — Select data source and field
| Setting | Description |
|---|---|
| Data source | The category of data to use: plant, ferti, spray, harvest, soil, or other. |
| Field | The field you want to create a guide file for. |
- Select a Data source (e.g.
harvest). - Select a Field from the drop-down.
The available-attributes table (Step 2) updates automatically to show only the tables and columns that match your selection.
Step 2 — Select attributes and build an equation
The middle section has three panels side by side:
- Available attributes (left) — every numeric column from the matching data tables. Each row shows the table name (e.g.
harvest.harvest_2024) and a drop-down of its numeric columns. Click a column in the drop-down to add it to the Selected attributes list. - Selected attributes (middle) — each attribute you add gets a reference number
[0],[1],[2], … To remove one, select its row and click Remove selected. - Equation (right) — a mathematical expression using those references.
| Equation | Meaning |
|---|---|
[0] | Use the raw value of the first attribute |
100 + [0] * 2 | Scale the first attribute and add a base value |
([0] + [1]) / 2 | Average two attributes |
[0] 0.8 + [1] 0.2 | Weighted combination |
The equation supports +, -, , /, // (floor division), % (modulo), (power) and parentheses. A default example 100 + [0] 2 is pre-filled.
Click Calculate min/max to evaluate the equation against the maximum and minimum of your selected attributes within the field. The preview appears below the button:
Max value: 312.5
Min value: 87.2
This lets you sanity-check the output range before creating the file.
Step 3 (Shapefile tab)
The Shapefile tab’s output settings:
| Setting | Default | Description |
|---|---|---|
| Data type | Integer (1) | Choose Integer (1) or Float (1.234) depending on what your machine expects. |
| Cell size (m) | 25 | The grid resolution in metres. Smaller = finer grid, larger file. |
| EPSG | 4326 | The coordinate reference system code. Leave as 4326 (WGS 84) unless your machine needs another CRS. For Swedish fields, 3006 (SWEREF99 TM) is common. |
| Rotation (deg) | 0 | Rotate the grid around its centroid. Useful when tramlines run at an angle. |
| Attribute name | Setting_distance | The attribute column name in the output shapefile (max 10 characters). |
| File name | guide_file | The output file name (without extension). |
Click Select folder… to choose the destination, then the green Create Guide File button.
GeoDataFarm will generate the grid (optionally rotated), average the selected attributes per cell, write the shapefile (.shp, .shx, .dbf, .prj), and add it as a styled layer to the map canvas.
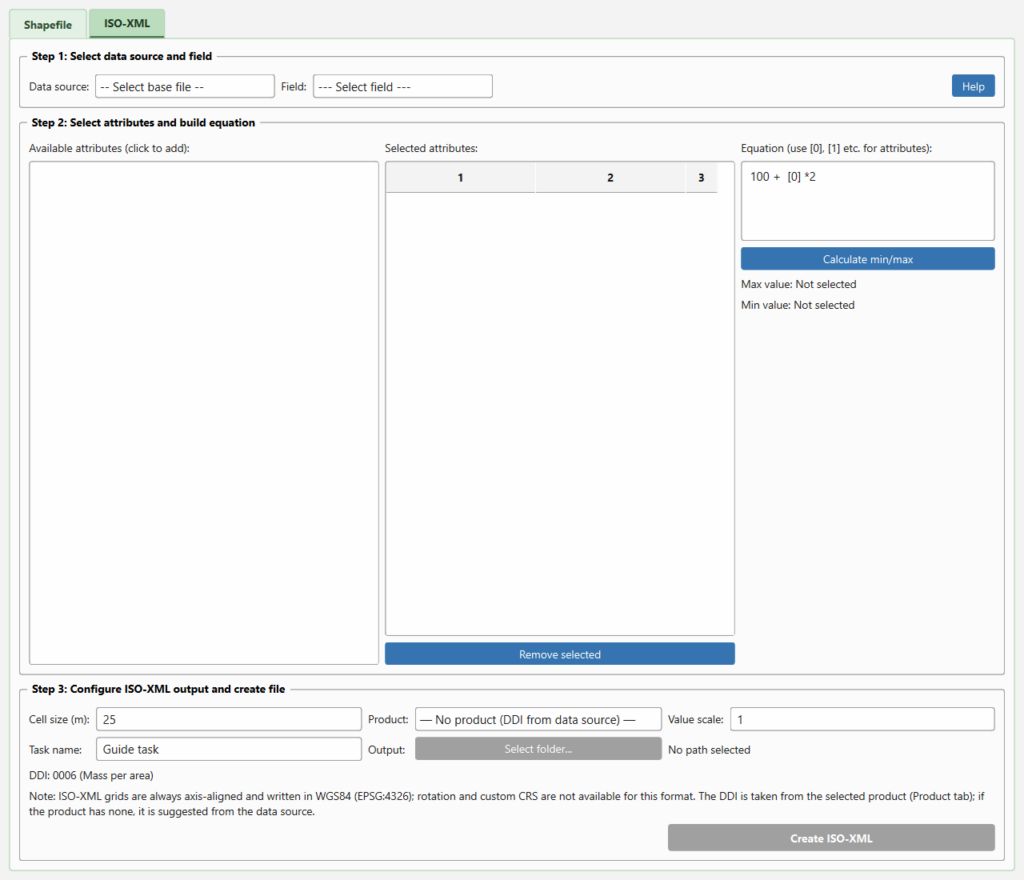
Step 3 (ISO-XML tab)
The ISO-XML tab writes an ISO 11783-10 Grid Type 2 prescription. Its output settings:
| Setting | Default | Description |
|---|---|---|
| Cell size (m) | 25 | The grid resolution in metres. |
| Product | — No product (DDI from data source) — | The product being applied. The list is populated from the Product tab; whatever you add or edit there appears here. |
| Value scale | 1 | The computed rate is multiplied by this factor and stored as an integer, to match your terminal’s expected resolution. |
| Task name | Guide task | The task designator written into TASKDATA.XML. |
Below the inputs, a read-only line shows the DDI that will be written, e.g. DDI: 0006 (Mass per area). The DDI is resolved as follows:
- the selected product’s QuantityDDI (set in the Product tab), otherwise
- a suggestion based on the data source (
ferti→ mass per area,spray→ volume per area,plant→ count per area,harvest/soil→ mass per area), otherwise - a default of
0006(mass per area).
Click Select folder… to choose the destination, then the green Create ISO-XML button. GeoDataFarm writes a TASKDATA sub-folder containing TASKDATA.XML and a binary grid (GRD00000.BIN). If you chose a product, its PDT definition is embedded and the prescription references it.
Note: ISO-XML grids are always axis-aligned and written in WGS 84 (EPSG:4326). Rotation and a custom CRS are therefore not available on this tab — use the Shapefile tab if you need them.
Tips
- Check the min/max values before creating the file. If the range looks wrong, adjust the equation or verify the data set.
- Cell size has a big impact: 10 m gives detailed grids (good for variable-rate seeding), while 50 m may be enough for fertiliser spreading.
- Manage products in the Product tab (under the ISO-XML section). Giving a product a QuantityDDI there means the ISO-XML tab writes the correct DDI automatically.
- EPSG matters (Shapefile tab) — if your terminal expects a projected CRS (metres), set EPSG accordingly;
4326(degrees) can cause issues on some equipment. - You can combine multiple data sources by selecting attributes from different tables (e.g. one from
harvestand one fromsoil) and combining them in the equation. - Click the Help button in the top-right corner of either tab for a quick summary.
Example workflow (Shapefile)
- Click 📄 Guide file in the sidebar and stay on the Shapefile tab.
- Set Data source to
harvestand select your field. - Click the
yieldcolumn fromharvest.harvest_2024→ it becomes[0]. - Click the
clay_contentcolumn fromsoil.soil_samples→ it becomes[1]. - Enter the equation:
80 + [0] 0.5 - [1] 0.3 - Click Calculate min/max to verify the range.
- Set Cell size to
20, EPSG to3006, Data type toInteger (1). - Set File name to
fert_guide_2026. - Select an output folder and click Create Guide File.
- The guide file appears on the QGIS canvas — ready to load onto your terminal.
Example workflow (ISO-XML)
- Click 📄 Guide file and switch to the ISO-XML tab.
- Set Data source to
fertiand select your field. - Add the attribute(s) you want and write your equation, then Calculate min/max.
- Set Cell size to
20and pick your Product (e.g. the fertiliser you defined in the Product tab). Check the DDI line shows the expected value. - Set a Task name, select an output folder, and click Create ISO-XML.
- Copy the resulting
TASKDATAfolder to your terminal’s media.